When you're evaluating a franchise, the numbers matter more than the pitch. But most FDDs bury the financial picture across multiple items — fees in Item 6, investment ranges in Item 7, earnings data (if it exists) in Item 19 — and leave it to you to piece together what it all means for your wallet.
The Money stop in FranVantage's Journey analysis pulls these numbers together into a set of financial tools designed to help you start thinking about the economics of the franchise. It's not a financial plan. It's a starting point — a way to pressure-test the numbers before you sit down with your accountant or financial advisor.
Here's what each tool does, what it can and can't tell you, and where you'll need to make your own adjustments.
The Financial Brief
At the top of The Money stop, you'll see a summary of the key financial metrics extracted directly from the FDD:
- Total Investment — the range from Item 7 (e.g., $85,000 – $320,000)
- Franchise Fee — the upfront fee from Item 5
- Royalty Rate — the ongoing percentage from Item 6
- Ad Fund — the marketing contribution rate from Item 6
These are pulled directly from the FDD. Below them is a narrative summary that contextualizes the numbers — what they mean in practice, how they compare, and what to pay attention to.
Sources & Uses
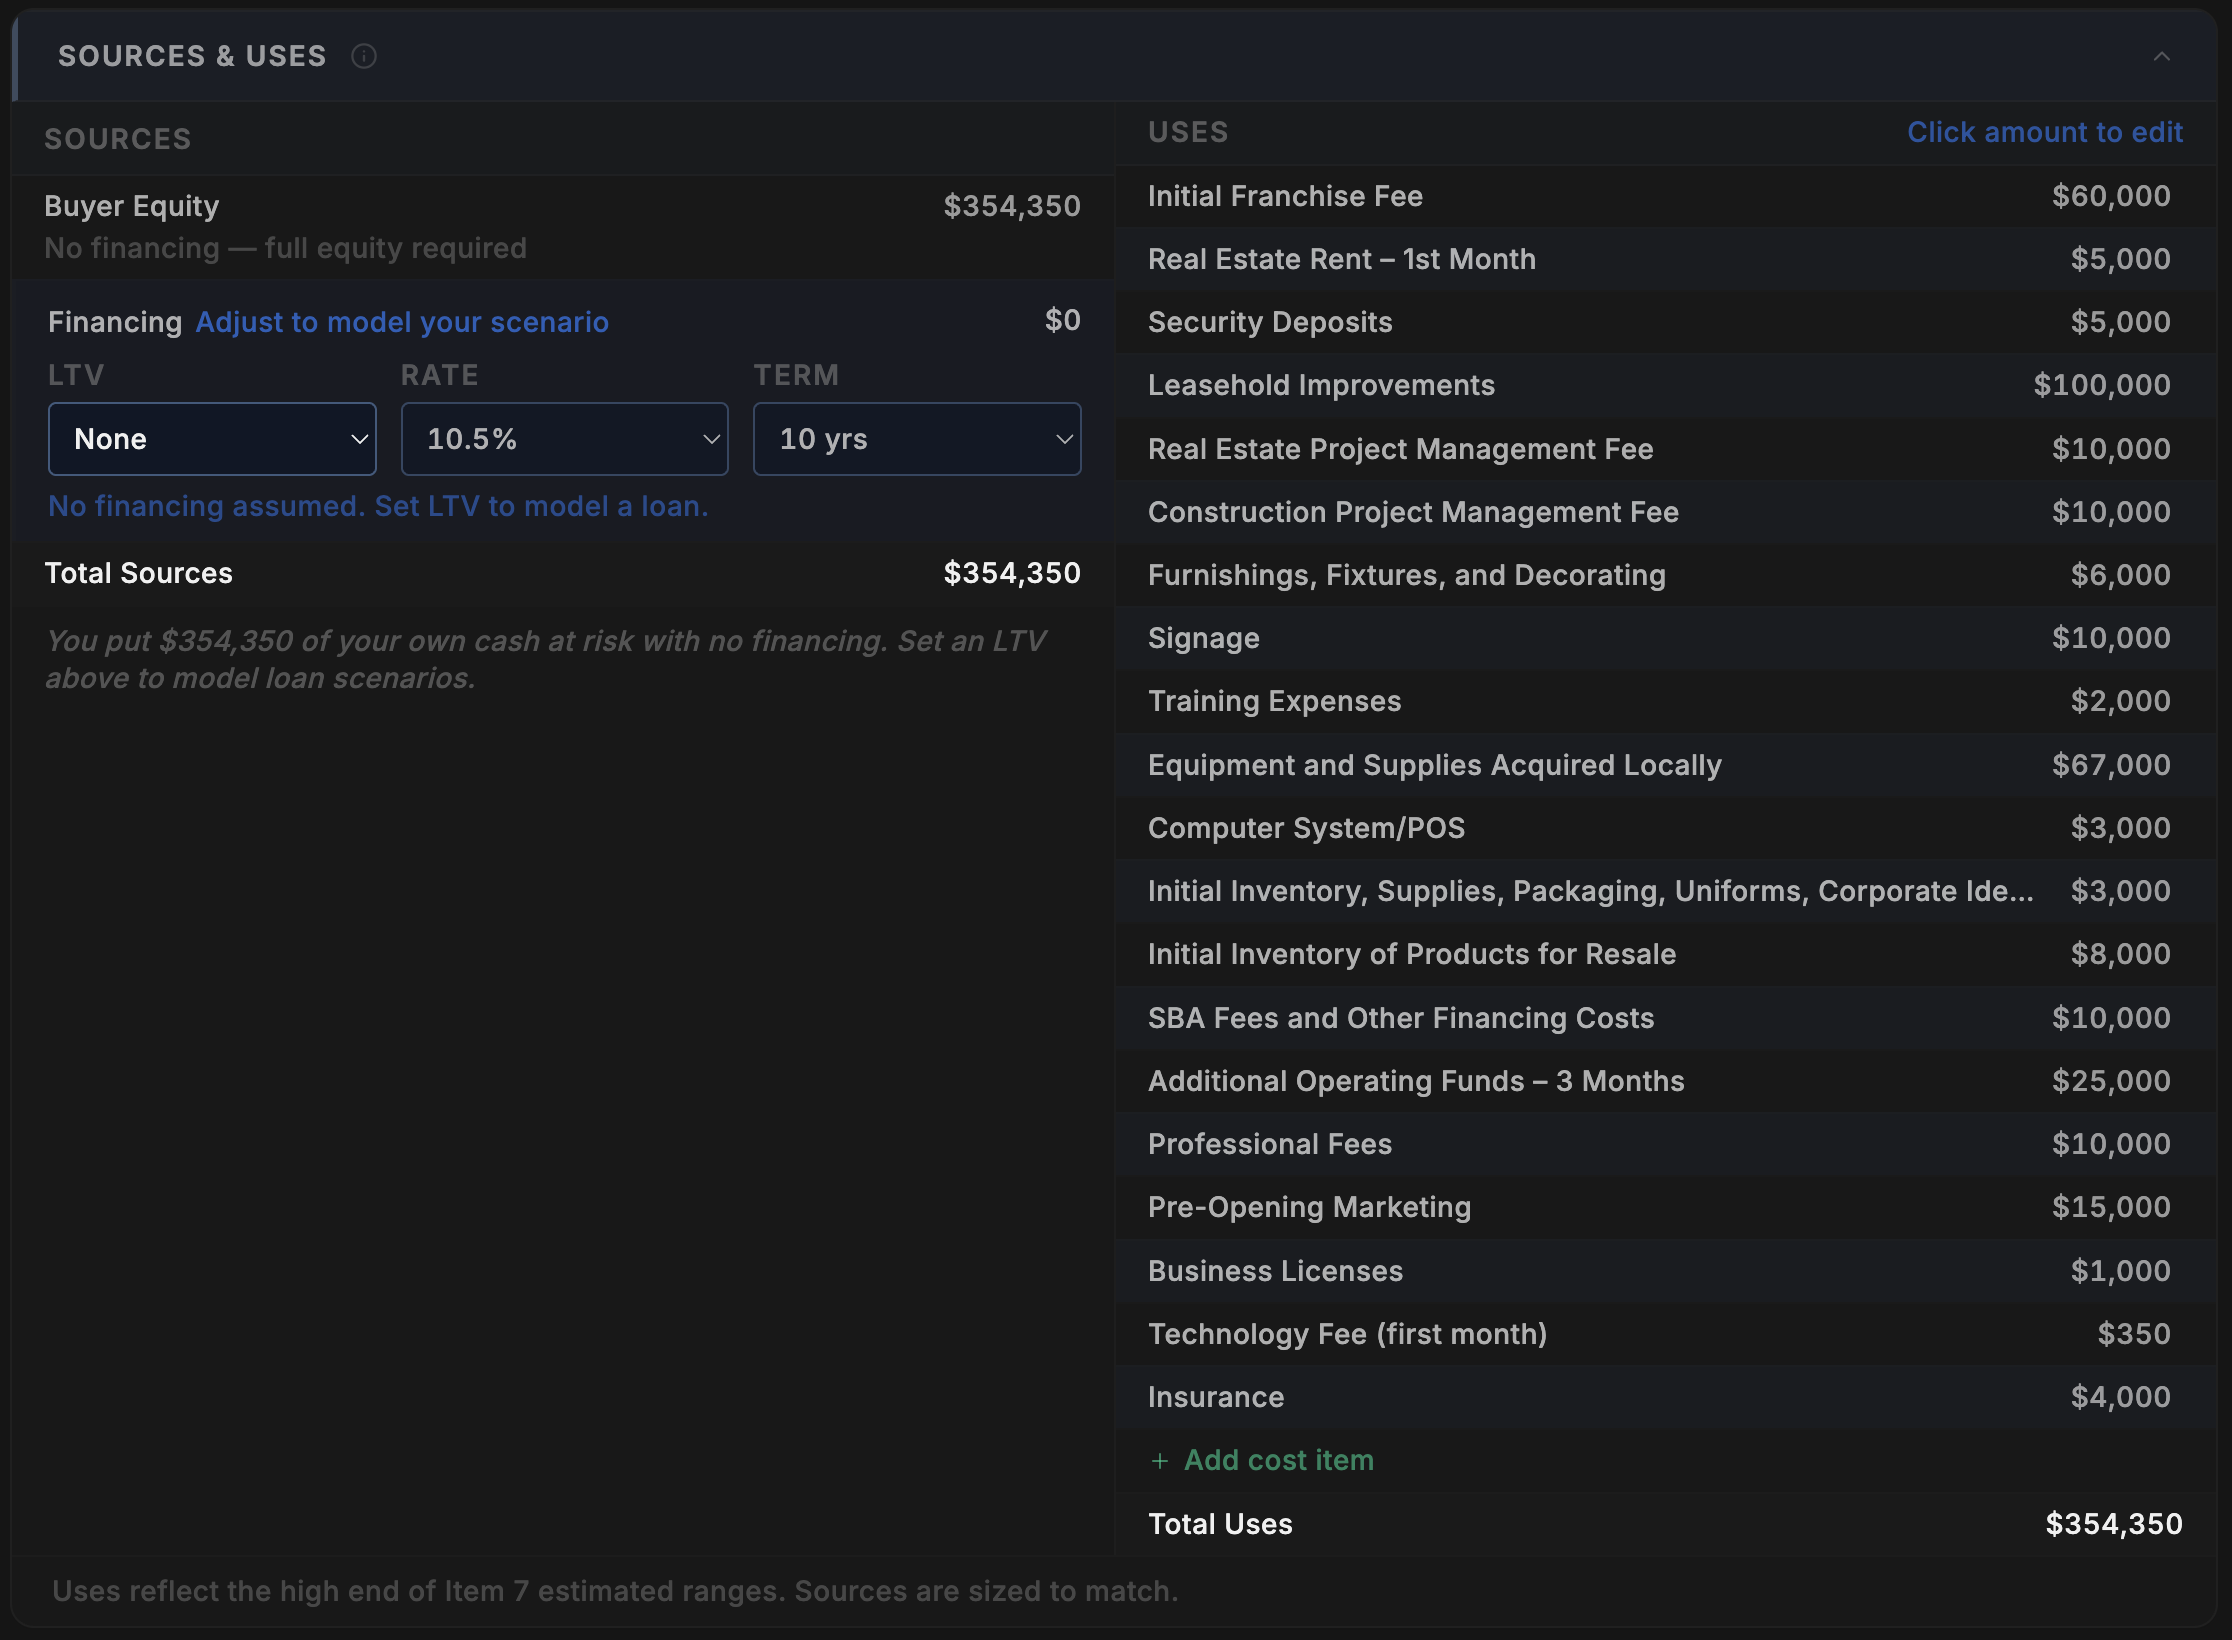
If you've ever worked with a credit analyst or sat through an investment committee review, you've seen a sources and uses table. It's one of the first things any financial professional builds when evaluating a deal — where is the money coming from, and where is it going? We apply the same framework here to your franchise investment.
Uses are pre-populated from the FDD's Item 7 investment table — franchise fee, build-out costs, equipment, inventory, working capital, and everything else the franchisor discloses. We make every effort to map each line item correctly, but in some cases the FDD's format makes exact mapping difficult. That's why we give you the flexibility to add your own cost items and — by clicking any pre-populated amount — edit it directly. This puts you in control of the assumptions.
Sources shows how you might fund the investment. By default, the model assumes no financing — 100% buyer equity. This gives you a clean starting point. From there, you can model a loan scenario by setting an LTV percentage, interest rate, and term. If you're considering an SBA 7(a) loan, for example, you might set 75% LTV at 10.5% over 10 years. The model recalculates your equity requirement, debt service, and downstream KPIs automatically.
Any changes you make here flow through to the rest of the model — adjusting your debt service, equity invested, and the KPIs that depend on them.
Fee Impact
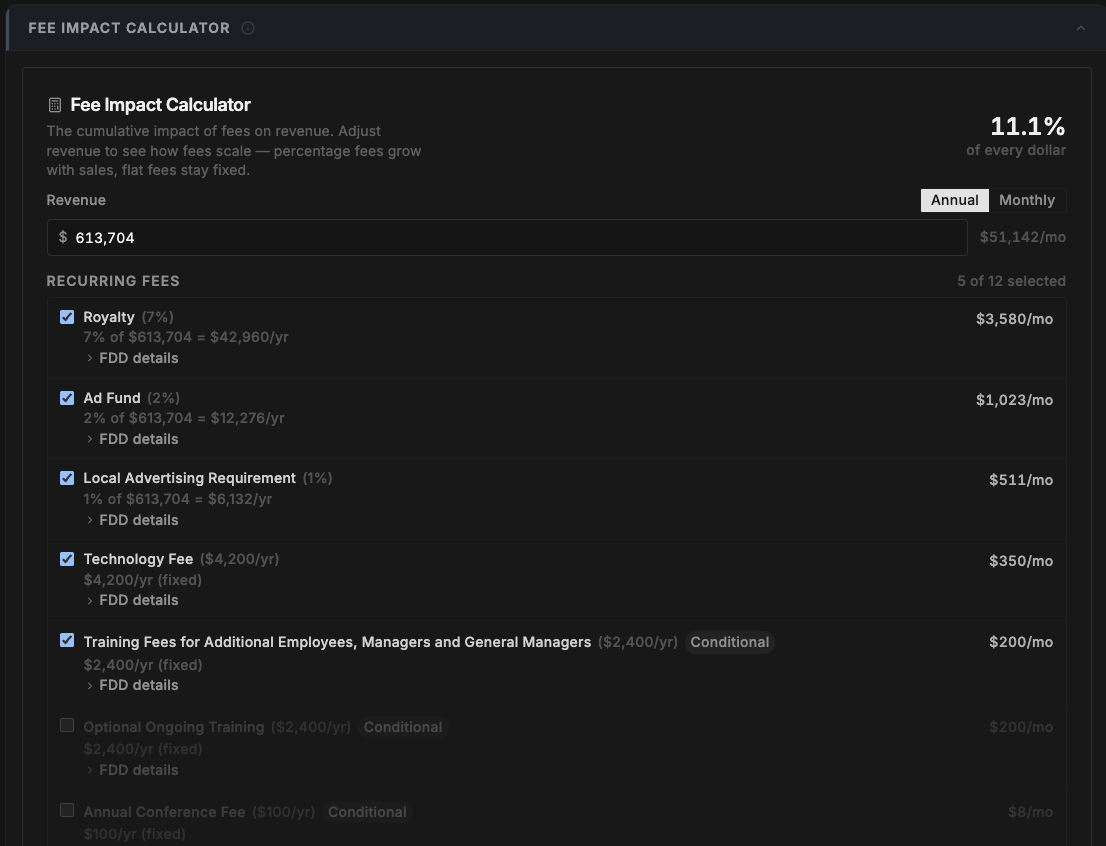
The fee calculator lets you enter a revenue number and see exactly what you'd pay in fees at that level. Royalties, ad fund contributions, technology fees — everything disclosed in Item 6 is broken down with the rate, the dollar amount, and an explanation of how each is calculated.
This is where some franchises get complicated. Some have minimum royalty floors — meaning if your percentage-based royalty is less than a fixed minimum, you pay the minimum instead. Others have graduated rates, tiered structures, or fees that only apply in certain situations. The calculator flags these complexities and shows you which rules are active at the revenue level you enter.
You can adjust the revenue number to see how fees change at different sales levels. This is useful for understanding at what point certain fee structures start to bite.
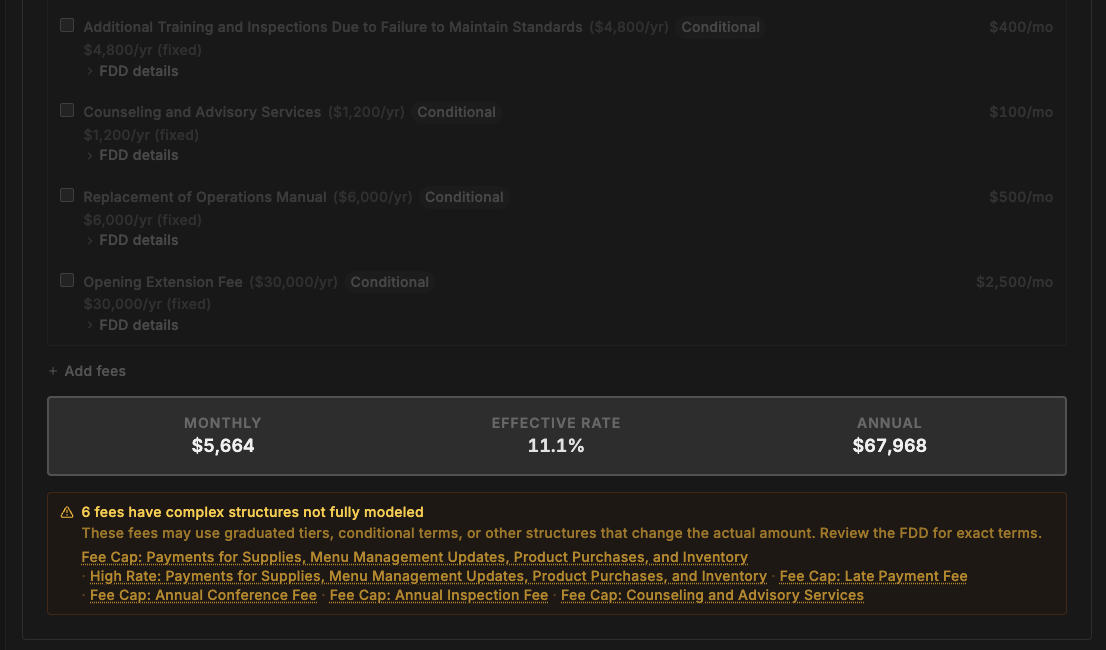
Fees marked as Conditional can be toggled on or off depending on whether they apply to your situation. Each fee has an expandable "FDD details" section that shows you exactly where in the document the fee was found.
At the bottom, the calculator totals your monthly fee burden and flags any fees with complex structures that couldn't be fully modeled — like graduated tiers or per-unit pricing.
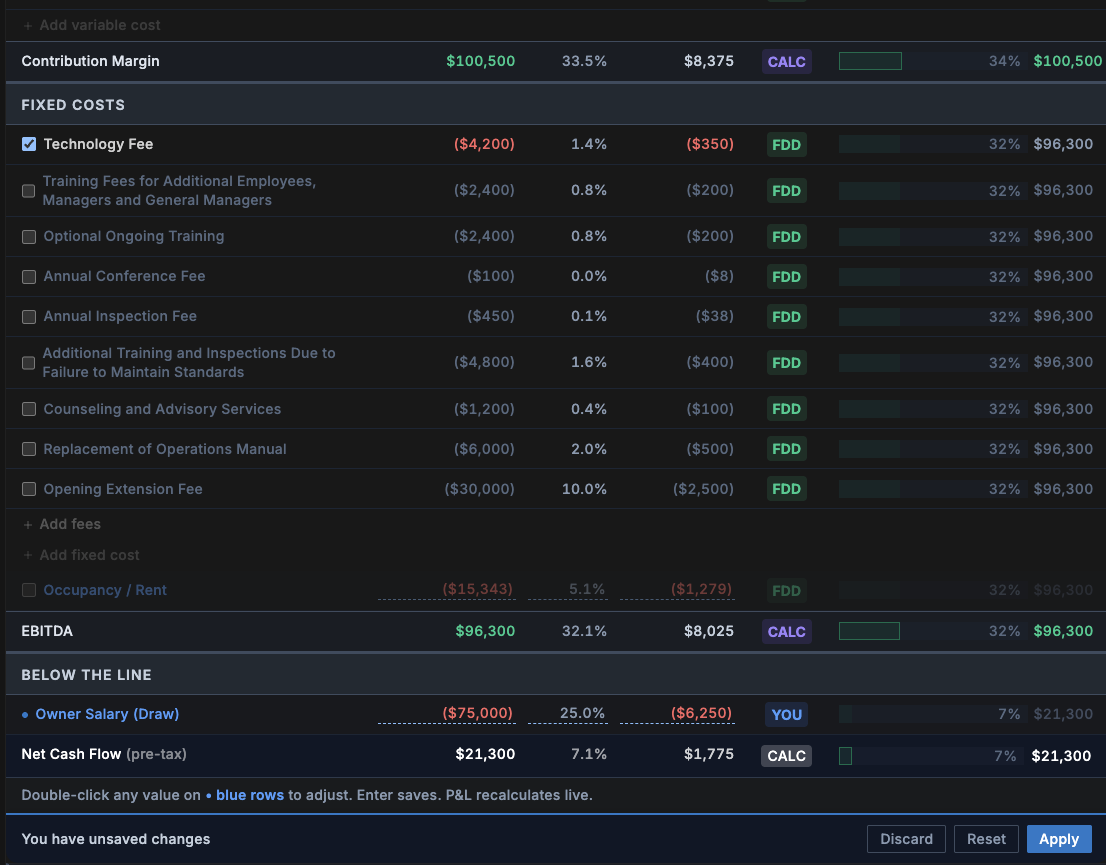
Proforma P&L
This is the tool that requires the most attention from you — and the most honesty about what you don't know.
The proforma builds a projected income statement using the median revenue from Item 19 (if the franchisor discloses it) and the fee structure from Item 6. It calculates a running balance from revenue down through variable costs, fixed costs, and ultimately your projected take-home.
Here's what each line shows:
- Revenue — starts with the FDD median (if available). You should adjust this to reflect what you realistically expect, not the franchisor's best-case number.
- Variable costs — costs that scale with revenue: COGS, labor, royalty, ad fund, technology fees, and other ongoing fees. Rates are pulled from the FDD where disclosed, or estimated from industry benchmarks where they're not.
- Fixed costs — costs that don't change with revenue: occupancy (rent), debt service (from your Sources & Uses assumptions), and owner salary (you set this).
- EBITDA — what's left after all operating costs.
- Owner Take-Home — what's left after debt service and any salary you've set.
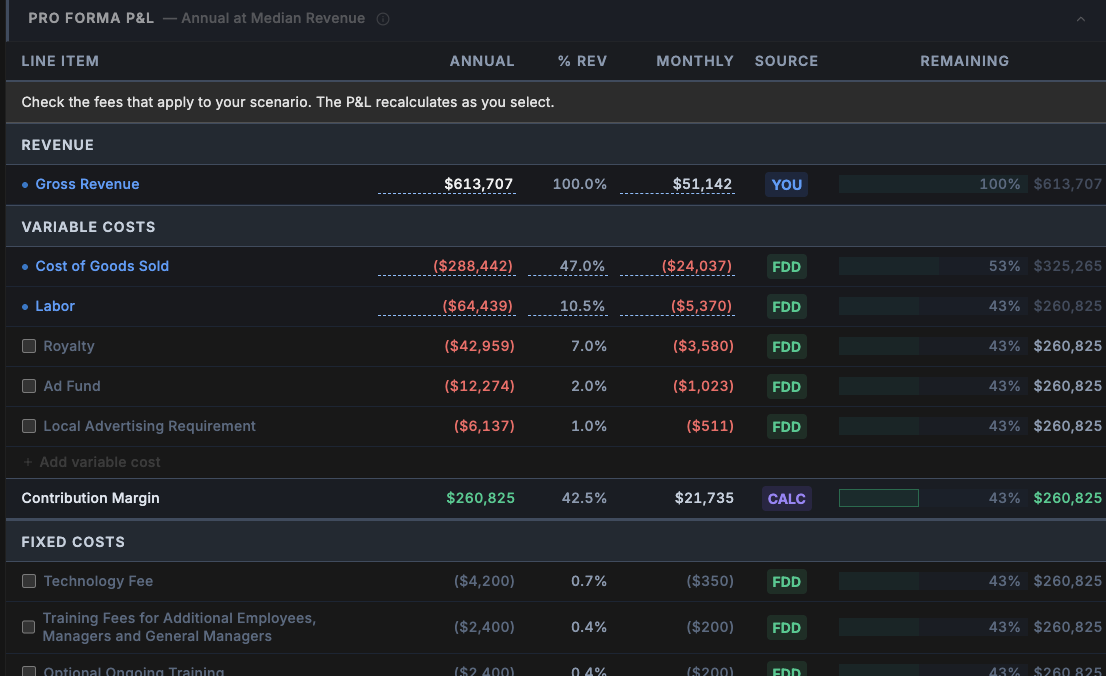
This is where your input matters most. The model can only work with the numbers it has. If the FDD doesn't disclose COGS or labor costs (and many don't), the model uses industry benchmarks — which may or may not reflect your specific franchise, location, or market. You're in control: check or uncheck the boxes next to each fee to include or exclude it from your scenario, and click into any of the highlighted values to update them based on the assumptions you'd like to run. The P&L recalculates as you go.
Hover over any cost line for helpful tooltip information explaining what it is and where it came from. You can also add your own custom variable costs, fixed costs, or fees that the FDD doesn't account for — giving you the flexibility to model a more complete picture of your actual operating expenses.
Every line item shows a source badge so you know where the number came from:
- FDD (green) — directly from the disclosure document
- CALC (purple) — calculated from FDD data
- EST (amber) — industry benchmark or estimate
- LOAN (gray) — from your financing assumptions
- YOU (blue) — a number you entered
If most of your P&L shows green and purple badges, the model has strong data to work with. If it's mostly amber, the model is relying on estimates — and you should treat the output with proportional skepticism.
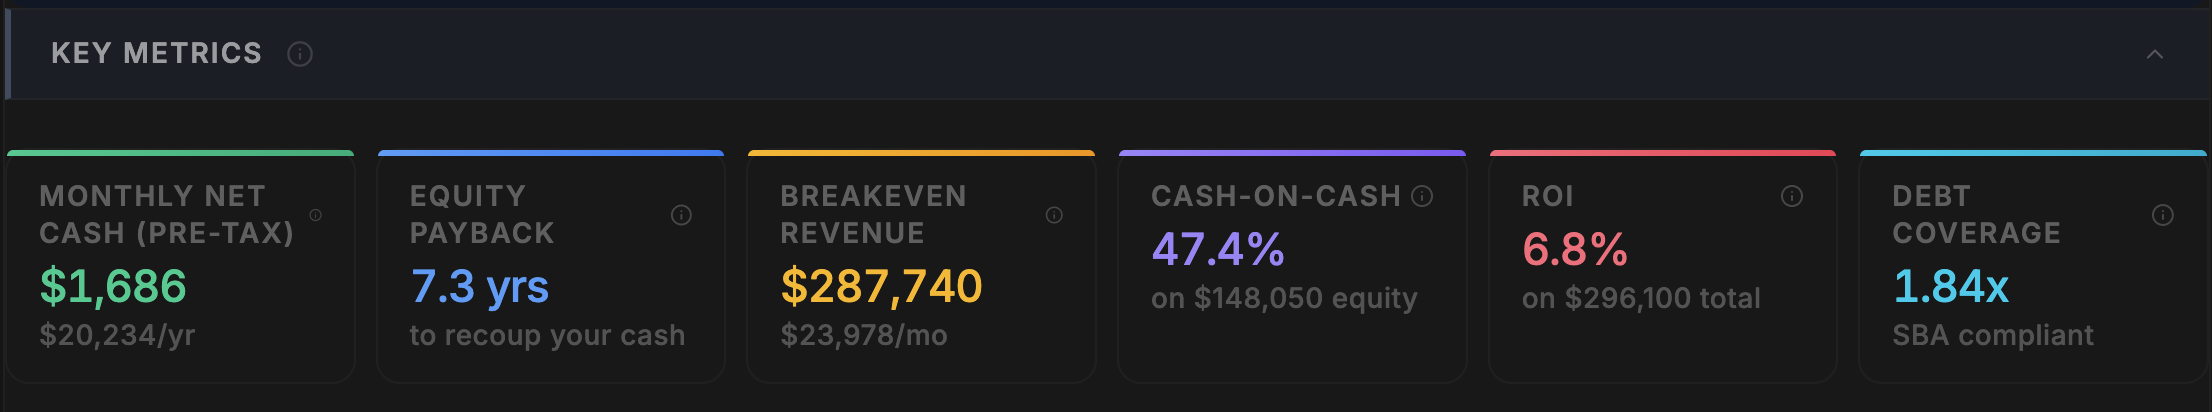
KPI Dashboard
Everything you enter in the P&L flows into five key performance indicators. These aren't static numbers — they recalculate every time you adjust an assumption. Which means the quality of these KPIs depends entirely on the quality of the inputs you provide. A take-home number built on FDD-sourced data tells you something different than one built on industry estimates you haven't validated.
- Monthly Take-Home — what you'd take home each month after all costs, debt, and salary
- Breakeven Revenue — the annual revenue needed to cover all fixed and variable costs
- Payback Period — how long it takes to recoup your initial investment from cash flow
- Cash-on-Cash Return — your annual cash flow as a percentage of the equity you invested
- DSCR (Debt Service Coverage Ratio) — whether your cash flow can comfortably cover your loan payments. Lenders typically want to see 1.25x or higher.
Hover over any KPI card to see the underlying calculation — the exact formula and the source of every input that went into it. This is the transparency layer: you can see not just the number, but how it was derived and where the assumptions came from.
These KPIs are only as good as the inputs behind them. A cash-on-cash return calculated from FDD-sourced data is more reliable than one calculated from industry benchmarks. The tool shows you the difference.
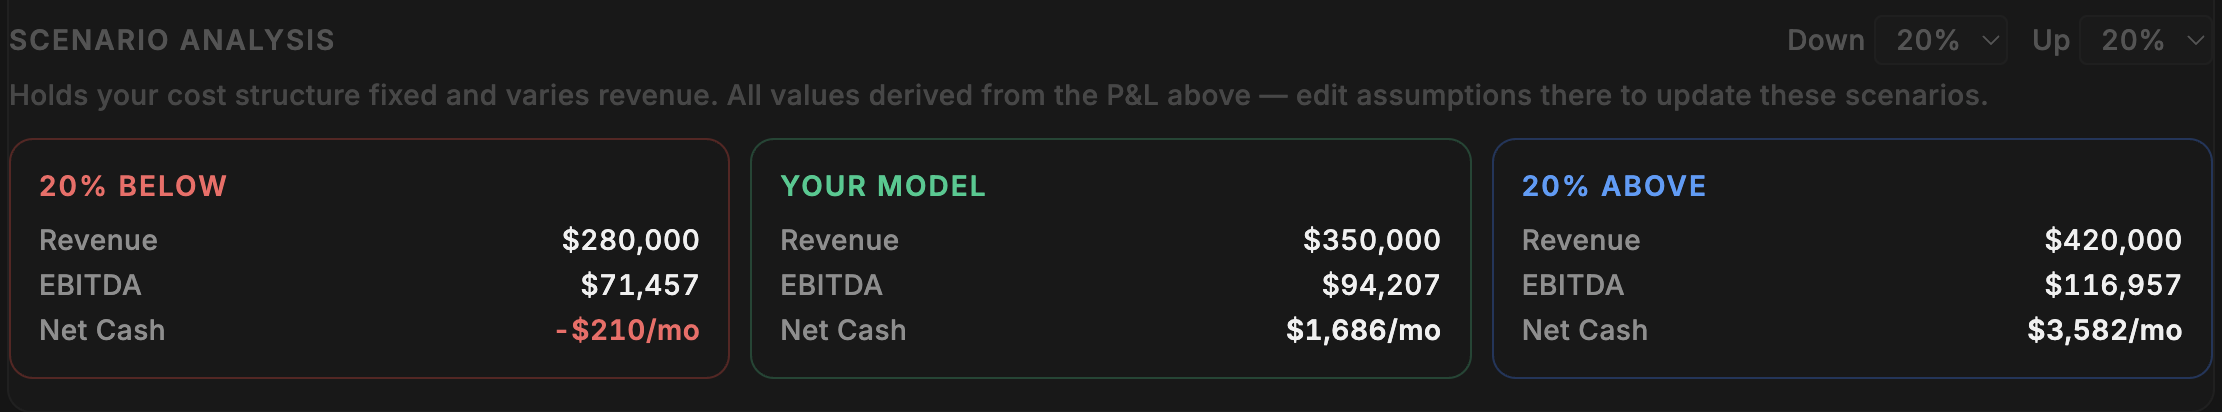
Scenario Planning
The model runs your P&L at three revenue levels:
- Base Case — the median revenue from Item 19
- Downside — a reduced revenue scenario (typically 20–40% below median, derived from FDD data where available)
- Upside — an elevated revenue scenario (typically 10–20% above median)
For each scenario, you see the resulting take-home, whether the business survives (positive cash flow), and the adjusted payback period. The downside scenario is arguably the most important one — it tells you what happens if things don't go as planned, which is the question most franchise buyers don't ask until it's too late.
What the Model Can't Tell You
This is important. The financial model is a starting point for thinking about the economics, not a prediction of what will actually happen. Here's what it doesn't account for:
- Your local market — rent, labor costs, and customer volume vary dramatically by location
- Ramp-up period — most franchises take 12–24 months to reach steady-state revenue. The model shows a snapshot, not a timeline.
- Seasonal variation — some franchise models have significant revenue swings that a flat annual projection doesn't capture
- Your personal financial situation — tax implications, opportunity cost of your time, existing obligations
- Changes over time — fee increases, rent escalations, contract renewals with different terms
- Qualitative factors — franchisor support quality, brand trajectory, competitive landscape
The model also relies heavily on whether the FDD discloses financial performance data in Item 19. If it doesn't, the model has to work with less data and relies more on industry benchmarks. That doesn't make it useless — it still structures the cost side clearly — but the revenue assumptions will be weaker.
How to Use These Tools
Here's what I'd recommend:
- Start with the defaults. Look at the model as-is before you change anything. This is what the FDD data produces on its own.
- Check the source badges. Understand where green (FDD) ends and amber (estimate) begins. That's your confidence boundary.
- Adjust the revenue. Don't accept the median as your reality. Talk to existing franchisees (Item 20 gives you their contact information) and form your own estimate.
- Set your owner salary. The default is $0. If you're planning to draw a salary, enter it — it changes the take-home and payback calculations significantly.
- Update the loan terms. This is done in the Sources & Uses model. If you've talked to a lender, put in your actual LTV, rate, and term instead of the defaults — it flows through to your debt service and every KPI that depends on it.
- Look at the downside scenario. If the business doesn't survive at 70% of median revenue, that's a risk you need to understand before you sign.
- Take it to a professional. These tools help you ask better questions. Your accountant or financial advisor can help you answer them.
The Money stop doesn't capture everything — no model can. It won't account for local market conditions, seasonal swings, ramp-up timelines, or the hundred small decisions that shape a real business. But it gives you a structured starting point for thinking about the economics, built from the data in your specific FDD. It's trying to help you organize the financial picture so you can have a more informed conversation — with franchisees, with your advisor, with your family, and with yourself.
Ready to see the numbers behind your franchise?
FranVantage's Journey analysis includes The Money stop with fee impact, sources & uses, proforma P&L, KPI dashboard, and scenario planning — all built from your specific FDD.
Get Your Free Brief